Pivotscan Watchlist
A watchlist tool that helps traders track market trends and organize saved stocks.
Windsurf, Cascade AI
Overview
Pivotscan's advanced traders had powerful search and filtering tools, but nowhere to put a stock once they found one worth watching. One trader had resorted to a physical whiteboard covered in ticker symbols and sticky notes. I designed the Watchlist feature from scratch in 8 weeks, with no existing patterns to build on. The feature shipped a 35% increase in site visits, beating the team's 25% goal.
Design Challenge
Advanced traders manage 50+ watchlists, not 5, and existing tools weren't built for that scale.
How might we... give traders a place to save, annotate, and organize stocks without leaving Pivotscan, while keeping the feature fast to learn?
Research + Opportunity
I ran a competitive audit of TradingView, TrendSpider, and TC2000, alongside interviews with Pivotscan's founder, engineering lead, an investor, and loyal customers. Competitors offered watchlist tools, but they were either bloated or too rigid, and all seemed designed for casual investors rather than advanced traders. A single user interview reframed the project from "how do we save stocks" to "how do we help traders remember their own reasoning," which shaped notes, color labels, and sortable rows. The project shifted from a storage problem into a memory problem, and became the central focus for the design.
Our Solution
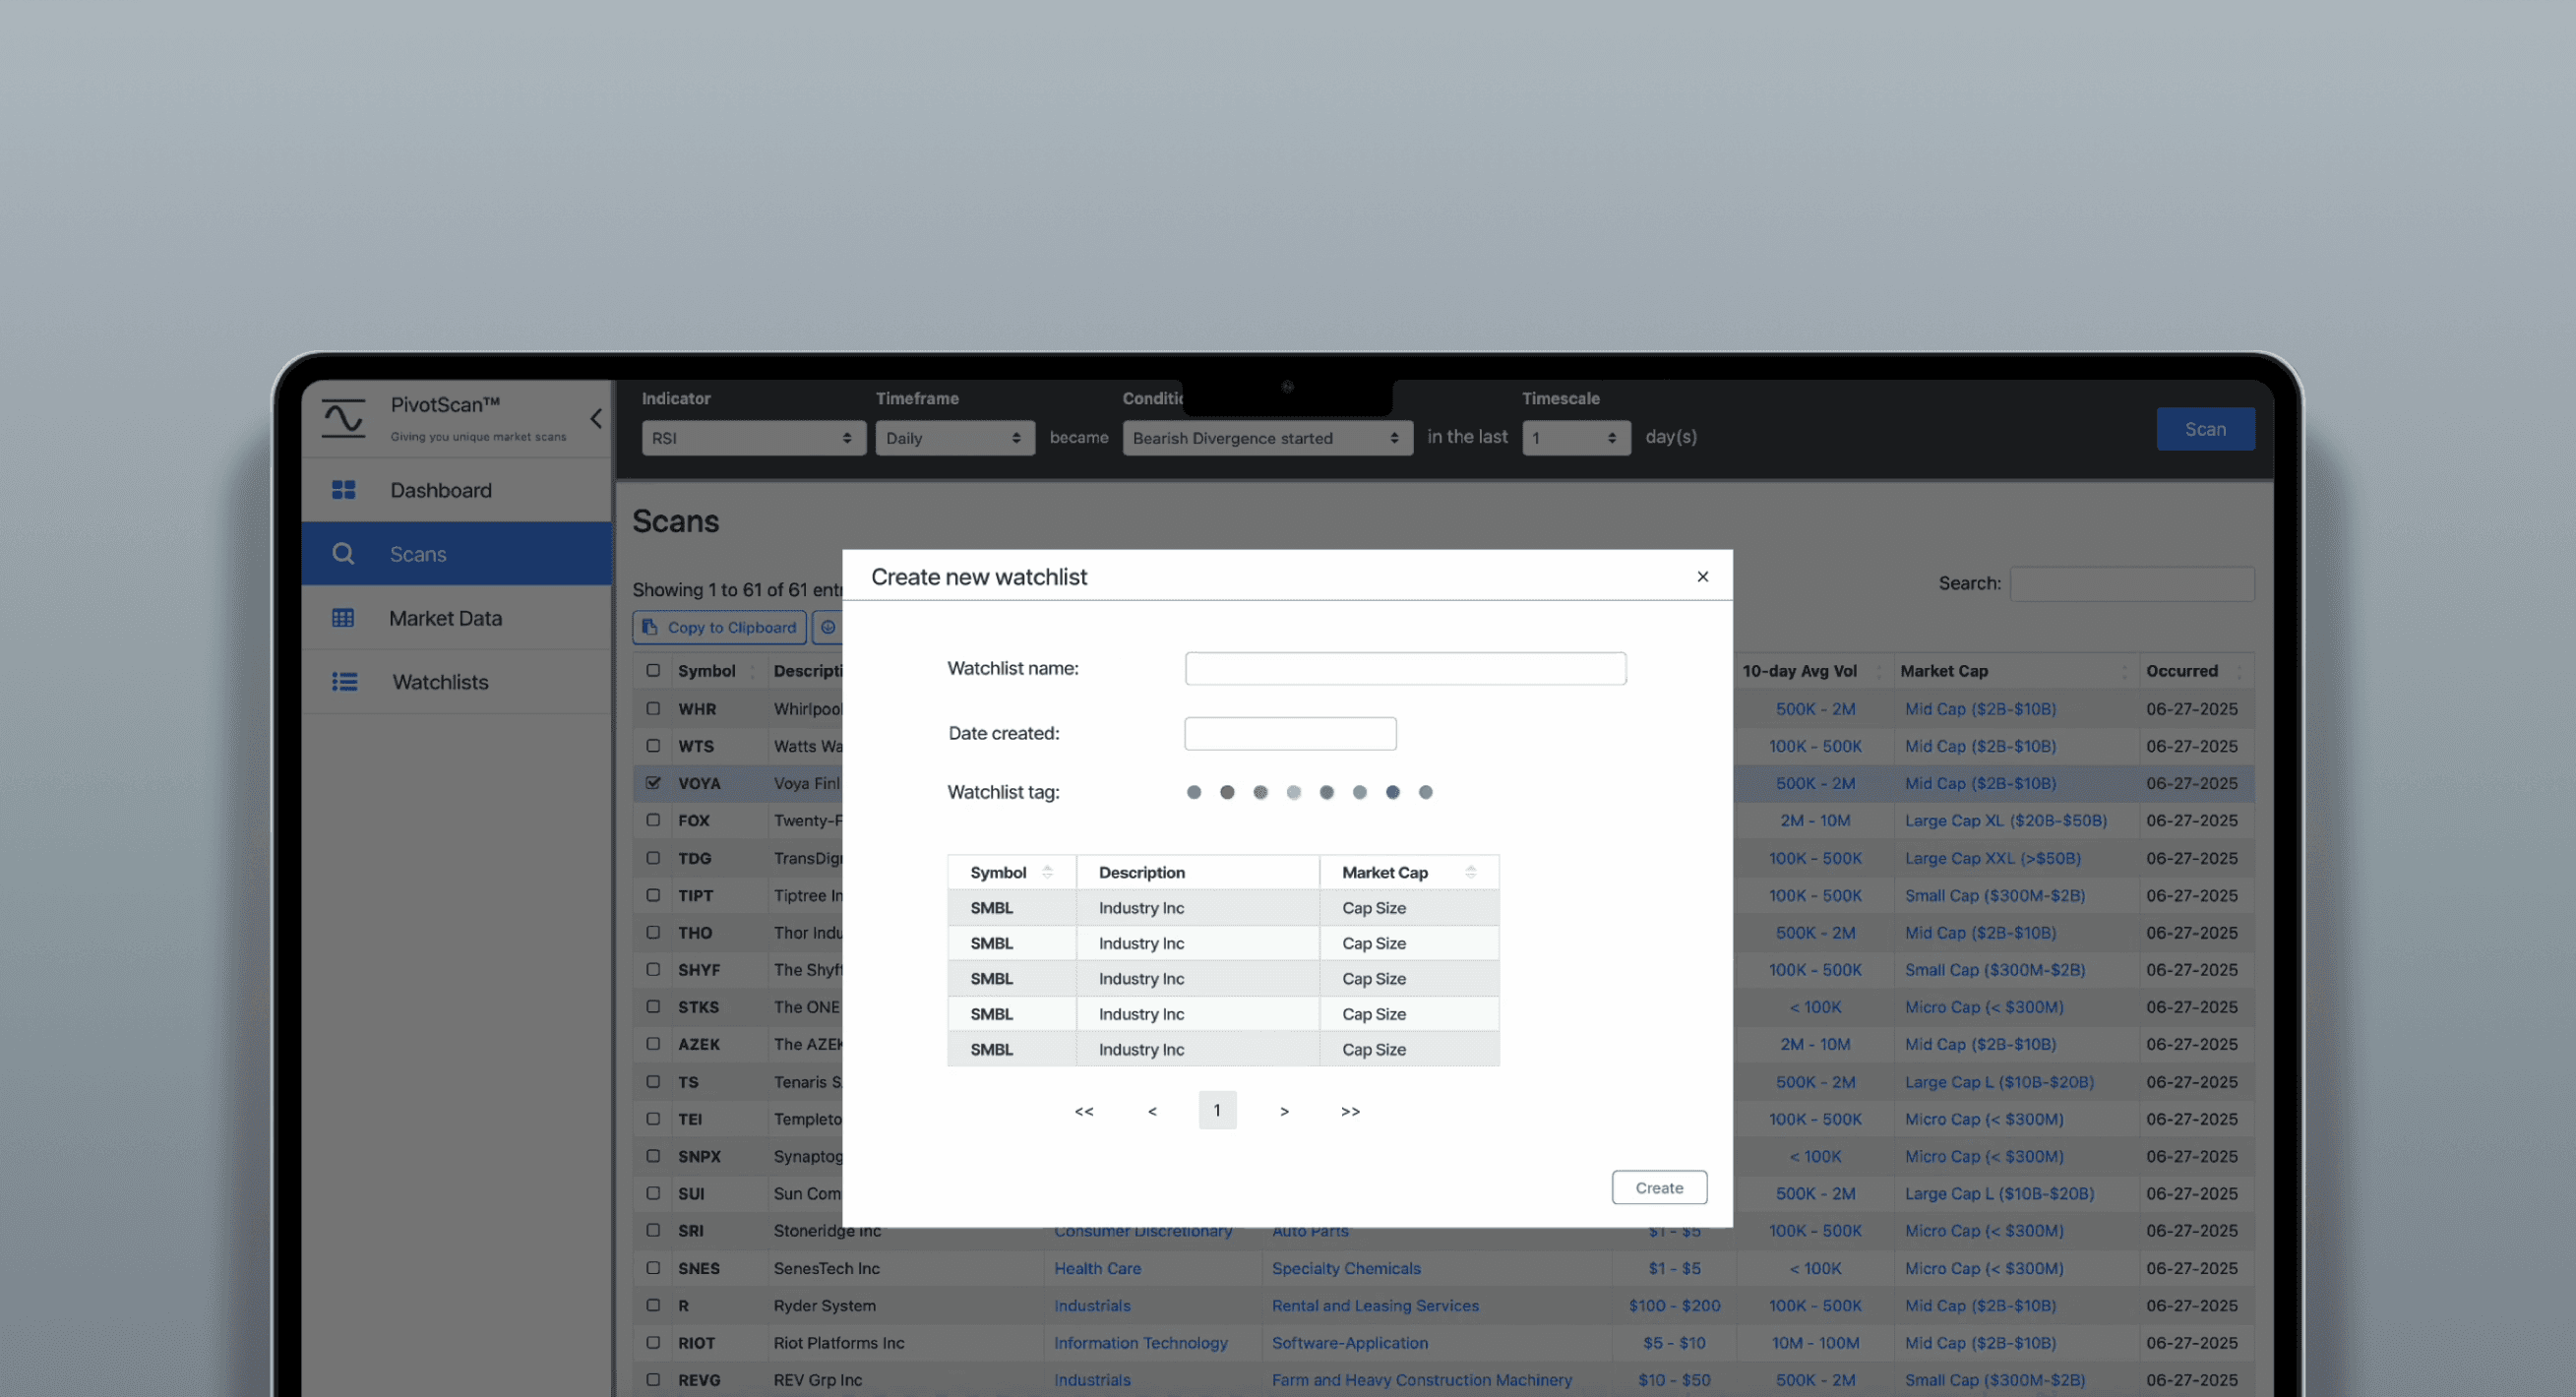
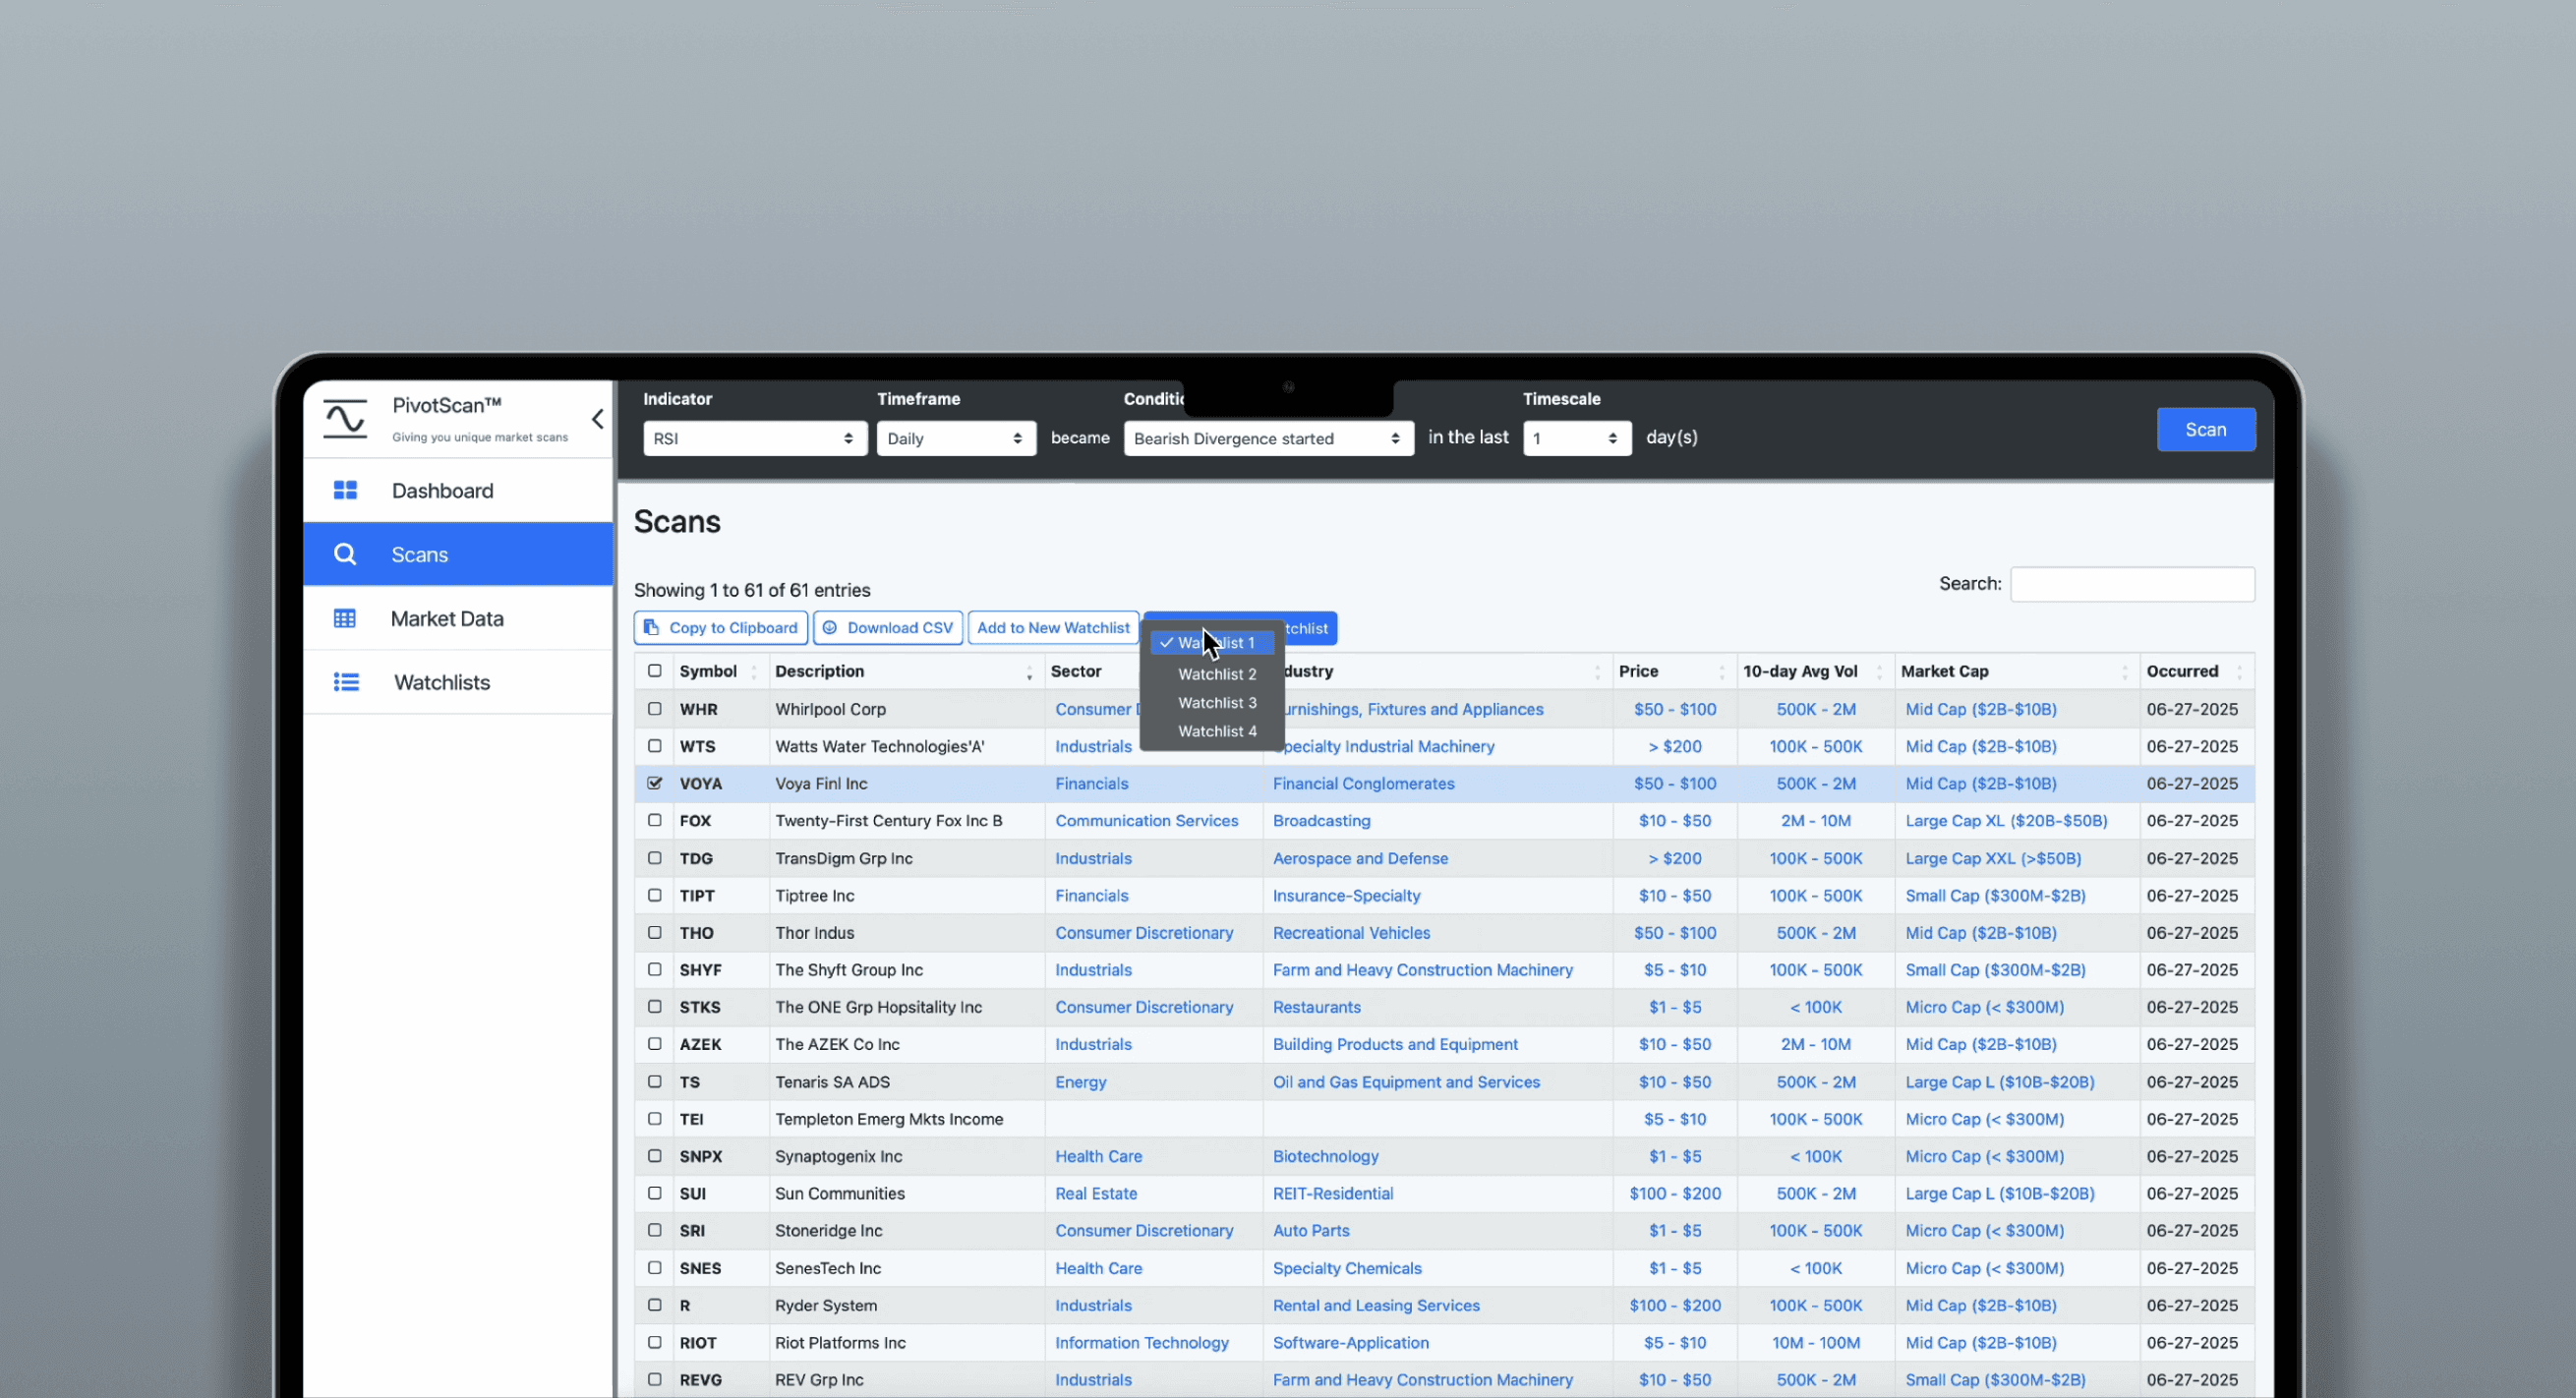
The Watchlist gave traders a centralized, table-based home for saved stocks, built around three features. Every feature shipped traced back to either user feedback or a gap in the competitive landscape.
Notes per stock to record thesis, target price, and reasoning, directly answering the sticky-note problem.
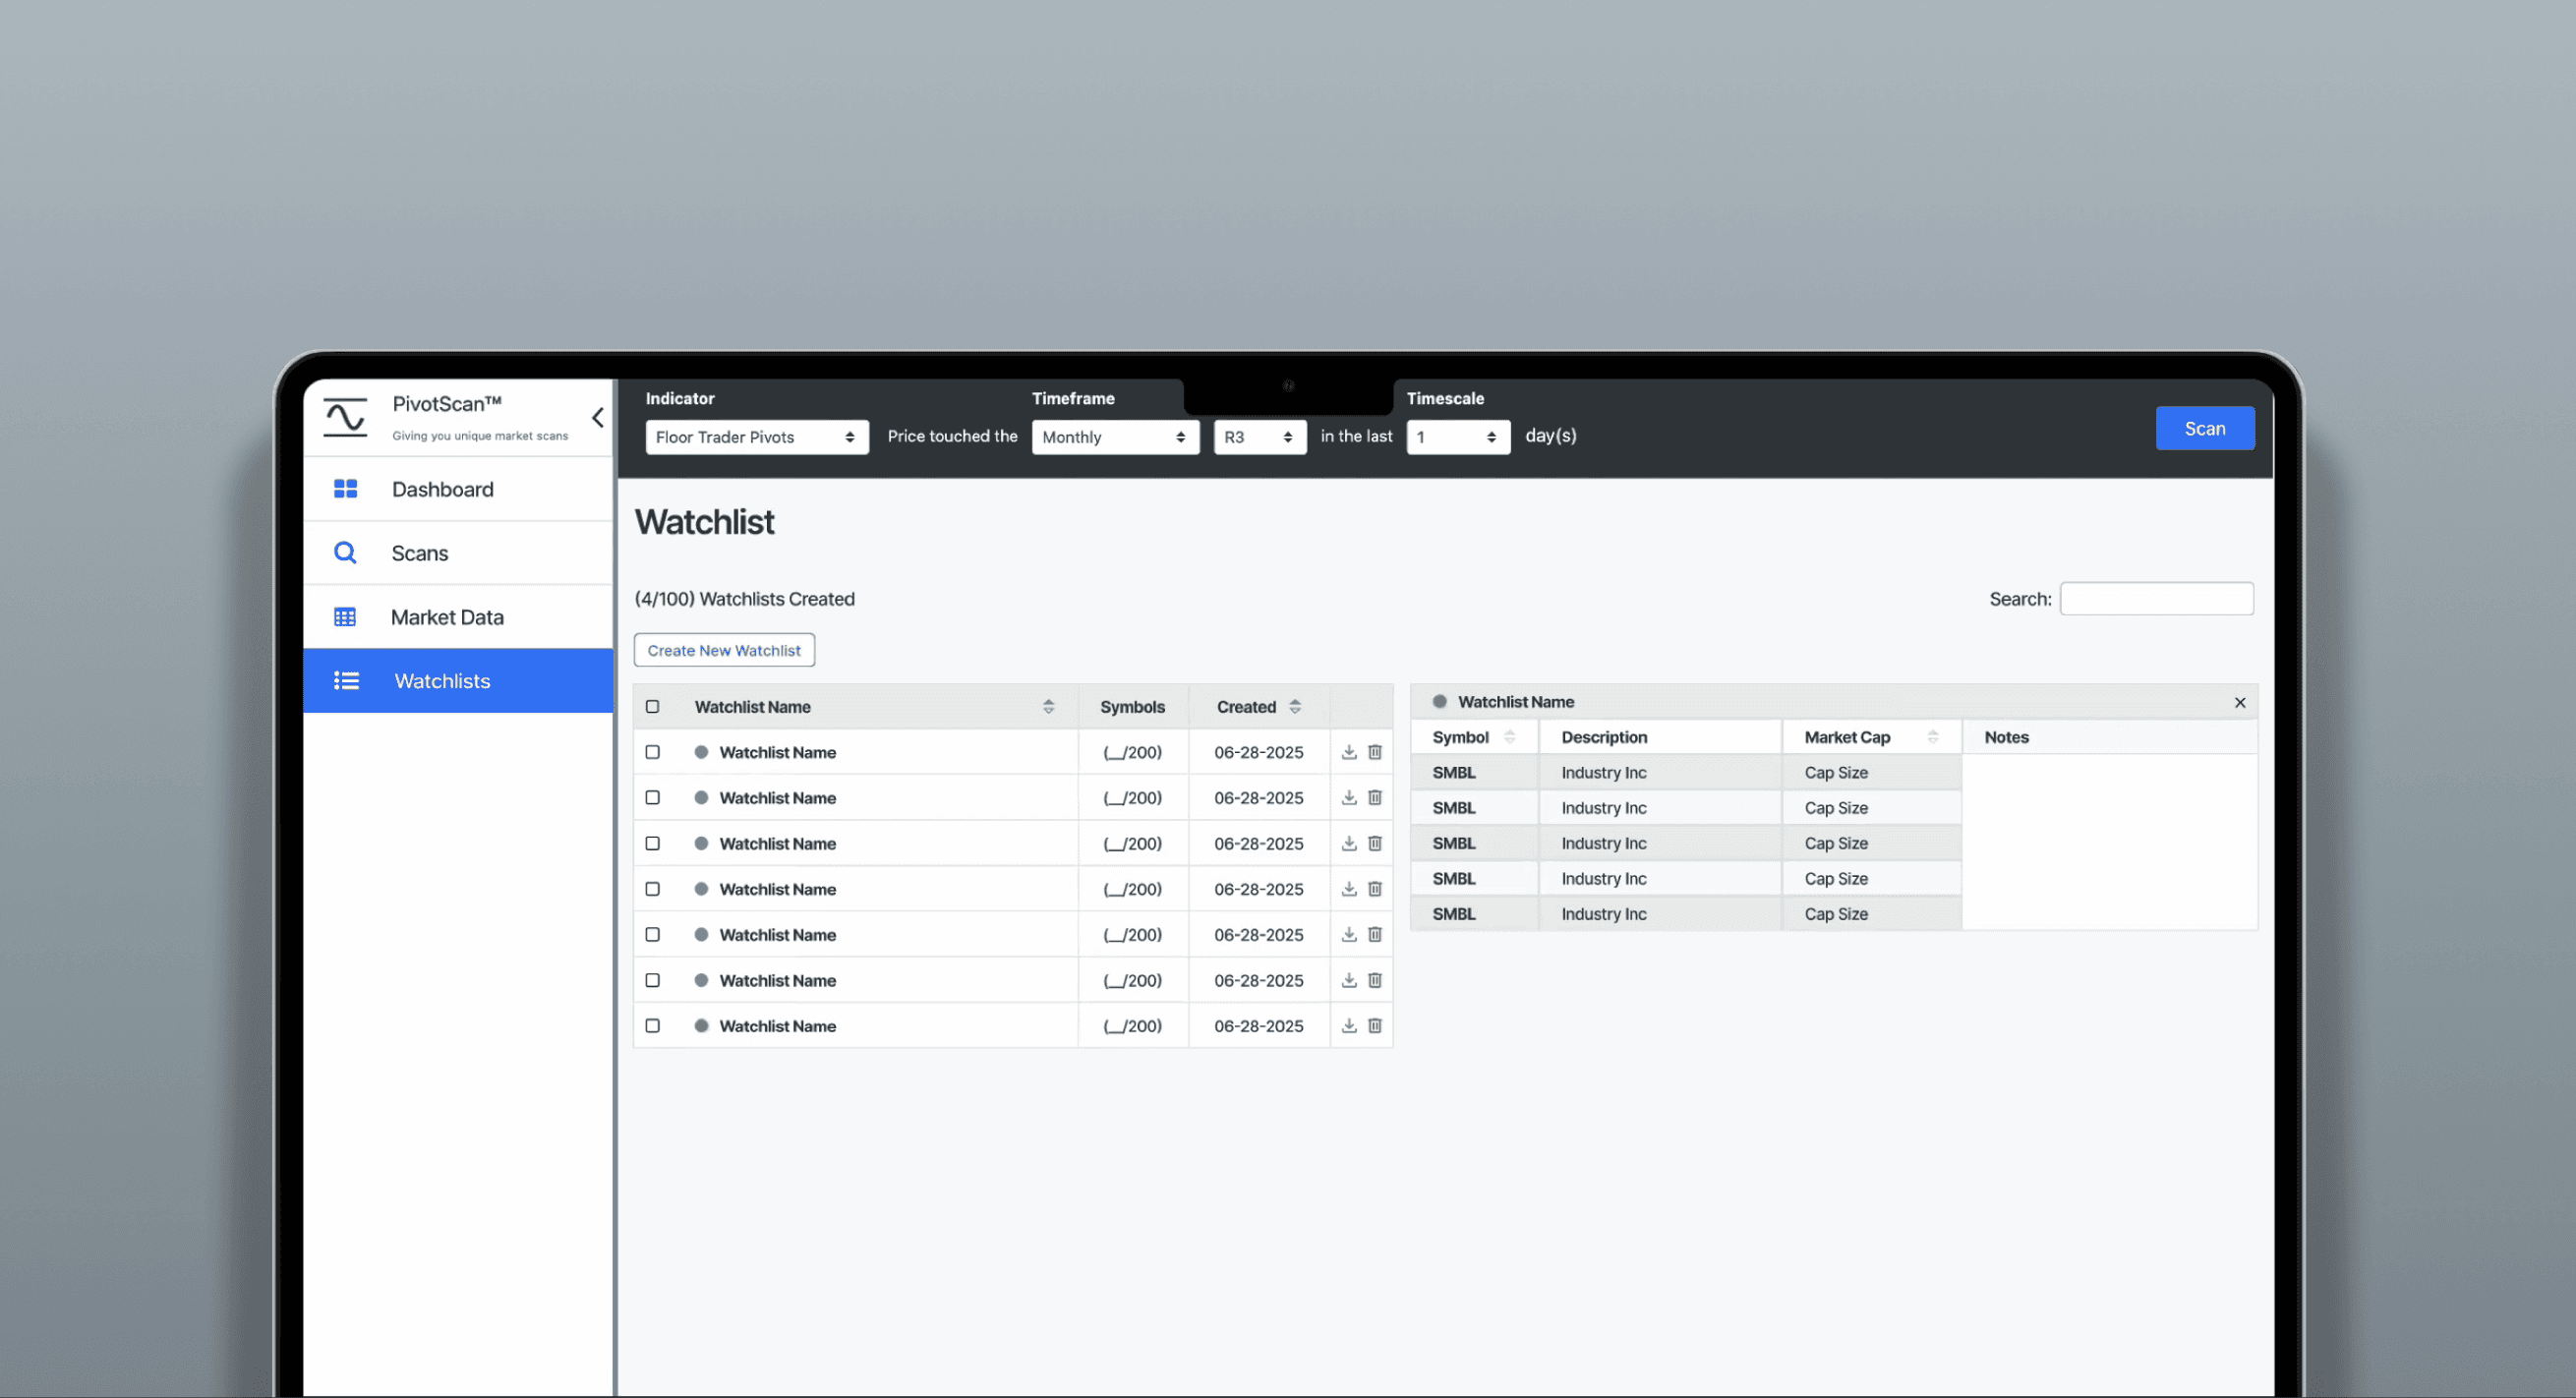
Color labels with an expanded palette for traders managing dozens of lists, not just aesthetic tagging.
Sortable and filterable rows that let traders surface what mattered most without manual reorganizing.
Feedback
- Short timeline limited user feedback.
Eight weeks left no room for structured testing, so the team relied on qualitative interviews instead. - No A/B testing meant picking one direction.
Without time to test variations, I had to commit to a single approach for the initial prototype. - Balancing business goals with user needs.
Stakeholders wanted a feature that supported future premium offerings, while traders wanted density and control.
Learning Outcomes
- Research is only as good as who you talk to.
One real user conversation unlocked more direction than hours of competitive analysis. - Constraints force clarity.
The eight-week timeline forced relentless prioritization, so what shipped was smaller but more intentional. - Respecting complexity beats simplifying it.
Designing for advanced users means more control and flexibility can be the right answer, not a compromise.